Increases in oil production and lower projected global demand growth for crude oil have contributed to declines in gas prices, beginning in June 2014 and falling 42% to the lowest point in January 2015. However, the impact of changing fuel prices is not uniform across transportation modes.
While the current fuel price drop is indeed significant, this decline is not unprecedented. Fluctuations provide an opportunity to evaluate responses to fuel price changes, particularly how these have affected and may continue to affect travel. The early indications, based upon a rolling 12-month average of gasoline sales, show a roughly 1.5% increase in demand for fuel in response to the 10% decrease in price.
The US Federal Energy Information Administration forecasts prices to remain under US$3 per gallon through 2016. If these prices are sustained, will it result in additional economic growth and commuting and/or more discretionary travel? Here we provide considerations for the highway and air sectors.
Highways
Until fairly recently, the conventional wisdom was that the elasticity of highway travel to fuel price was roughly -0.3. In other words, a 10% decrease in fuel prices would lead to a 3% increase in travel. Studies from the last decade, however, reveal that the elasticity of vehicle miles traveled (VMT) to fuel prices is considerably lower, ranging from -0.03 to -0.17 in the short run and -0.12 to -0.32 in the long run.
Various explanations have been put forward for the apparent decline in fuel price responses. Jonathan Hughes, Chris Knittel and Daniel Sperling propose that fuel costs are a considerably smaller share of household expenses than they were thirty years ago, and that fuel economy standards have further contributed to reduce the share of fuel in consumer expenditures.
Steer Davies Gleave’s work on a wide range of toll facilities tends to confirm the findings of this research. In general, accounting for diverse trip purposes, incomes and transit alternatives, our experience suggests that the short run elasticity to fuel price (the price response over several months) is on average -0.1 for autos and as low as -0.06 for trucks.
It is too early to say what the long term impact of lower fuel prices will be, but we will need to continue to review whether lower prices in the summer result in additional non-discretionary travel, and whether consumer long-term behavior changes if prices remain below US$3.
Aviation
Jet fuel costs typically represent 35% or more of operating expenses for airlines. The actual proportion depends on factors such as the type of routes operated, aircraft fuel efficiency, and the effectiveness with which an airline manages costs elsewhere in its business.
Having sought to operate profitably with oil prices previously rising to over US$100 per barrel (jet fuel prices tend to rise at a similar rate), airlines will have taken the benefit recently of the reduction in this single largest cost item. Where airlines have passed some of the savings on in the form of lower fares, passengers will have benefited.
Equally, a lower cost environment may persuade airlines to think again about their plans for capacity growth, potentially bringing some increases forward and/or encouraging investment in new routes that might not otherwise have been possible. All of these effects can help to stimulate passenger volume growth, especially in the near term.
There may, however, be some offsetting effects, which dampen the impact of lower fuel costs; for example where airlines have hedged their jet fuel purchases in advance, they may be paying for their fuel at above market rates, if the hedge contracts reflected earlier prices.
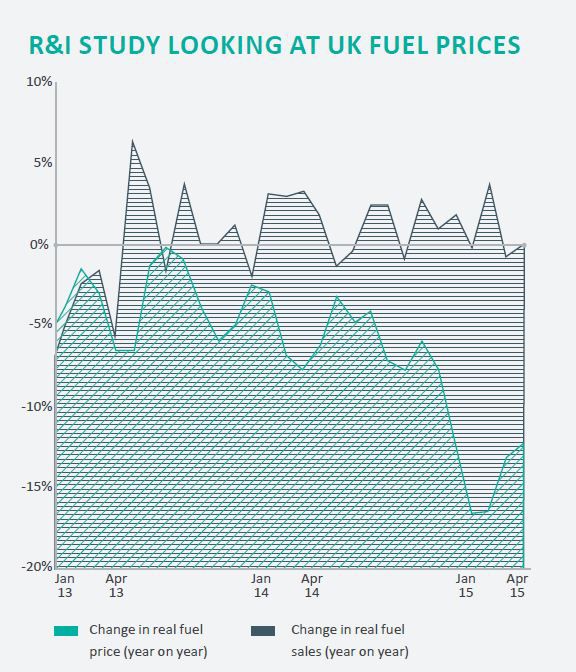
The significant fuel price drop in the US has also happened in the UK. A Steer Davies Gleave Research and Innovation (R&I) initiative to investigate the effect of lower fuel prices on UK road users has compared real fuel prices to fuel sales by volume (data on travel volumes was not available, so fuel sales were used as a proxy). The investigation discovered, as with the US findings, that there was minimal change in sales during the recent decline in fuel prices. In the above chart, showing year-on-year percentage changes in fuel sales and prices for the last 2 years, it can be seen that the large recent drop in fuel prices has, contrary to expectations, produced no increase in fuel sales.
