What’s happening on Europe’s roads? We have always been able to say that ‘whatever the economic climate, road traffic never falls’, and indeed, from the early 70s through until the middle of the last decade that might have held - but no longer!
Yes, there were hiccups – in the early 70s when OPEC cut the flow of fuel and in 1991 when the last big recession hit Europe – but the picture then was clearer. Now, however, it is anything but!
There were, in some countries, hints that the apparently iron relationship between economic and traffic growth was actually beginning to look shaky in the early levels of the last decade: since 2007, with the financial crisis and the ongoing subsequent recession, the picture has changed dramatically. Traffic levels on our motorways – for both private and commercial vehicles – have stagnated and often fallen. So our clients – the owners, investors and lenders for tolled road across Europe – are asking ‘What’s going to happen next? How far can traffic fall – and what will happen when even the most stricken economy begins its climb back to health?’
To try to answer these questions, in our different projects we have sought to understand what drives the rise and fall of traffic across this period. In the past, we have relied heavily on GDP as an indicator of performance. Does the evidence suggest that this remains a reliable proxy?
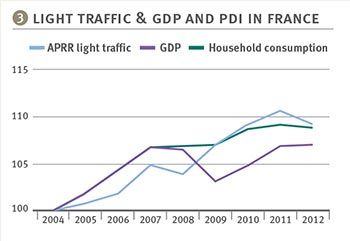
At least on the APRR network in France (covering around 2000km of autoroute in the east and south east of the country), this looks unlikely.
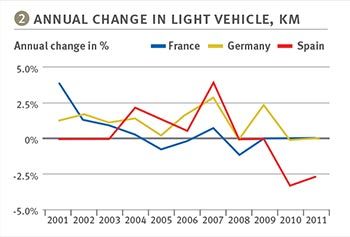
After a first reaction to the fuel price hike across the spring/summer of 2008, light vehicle traffic initially remained pretty buoyant. But as the economy dipped for a second time, traffic dropped and has not yet shown much recovery.
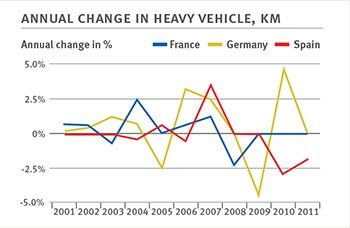
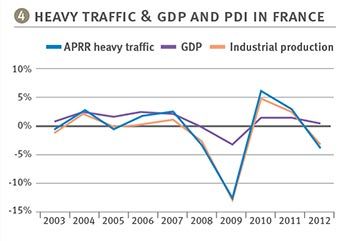
The picture is more dramatic for trucks. Almost immediately, and as the recession hit, truck traffic fell dramatically – well ahead of the fall in GDP. But after that traffic grew through 2010, to fall away again in 2011 and 2012.
It is clear that we now have to look elsewhere to understand how traffic rises and falls. For cars, it seems as if measures of personal disposable income (PDI) provide a more powerful explanation. For many years, until perhaps 2005, PDI appeared more or less to track GDP. But through the credit boom and contraction, and on into the years of recession, PDI is clearly following a different path. Perhaps this provides a better indicator?
And for trucks? Certainly, measures of industrial production have more closely tracked levels of truck movement. At the outset of the recession, production fell dramatically – seemingly as a response to an equal reduction in the levels of stock held as inventory. Since then, the fall has been far less – and traffic levels have stabilised and even grown. In 2012, however, it seems that as confidence in a speedy recovery dwindled, there was a further fall in inventory and a drop in volumes of traffic moved.
Are these the indicators for growth over the next years? And as the economy finally recovers, do we expect traffic to reach the levels we saw before the Great Financial Crisis?